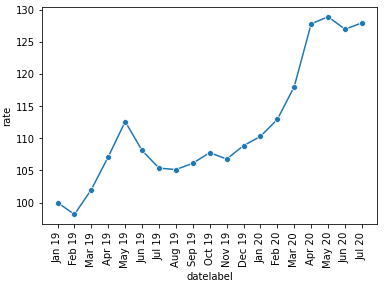
這是數(shù)據(jù)data = {'date': {0: pd.Timestamp('2019-01-31 00:00:00'), 1: pd.Timestamp('2019-02-28 00:00:00'), 2: pd.Timestamp('2019-03-31 00:00:00'), 3: pd.Timestamp('2019-04-30 00:00:00'), 4: pd.Timestamp('2019-05-31 00:00:00'), 5: pd.Timestamp('2019-06-30 00:00:00'), 6: pd.Timestamp('2019-07-31 00:00:00'), 7: pd.Timestamp('2019-08-31 00:00:00'), 8: pd.Timestamp('2019-09-30 00:00:00'), 9: pd.Timestamp('2019-10-31 00:00:00'), 10: pd.Timestamp('2019-11-30 00:00:00'), 11: pd.Timestamp('2019-12-31 00:00:00'), 12: pd.Timestamp('2020-01-31 00:00:00'), 13: pd.Timestamp('2020-02-29 00:00:00'), 14: pd.Timestamp('2020-03-31 00:00:00'), 15: pd.Timestamp('2020-04-30 00:00:00'), 16: pd.Timestamp('2020-05-31 00:00:00'), 17: pd.Timestamp('2020-06-30 00:00:00'), 18: pd.Timestamp('2020-07-31 00:00:00')}, 'rate': {0: 100.0, 1: 98.1580633244672, 2: 102.03029115707123, 3: 107.12429902683576, 4: 112.60187555657997, 5: 108.10306860500229, 6: 105.35473845070196, 7: 105.13286204895526, 8: 106.11760178061557, 9: 107.76819930852, 10: 106.77041938461862, 11: 108.84840098309556, 12: 110.29751856107903, 13: 112.93762886874026, 14: 118.04947620270883, 15: 127.80912766377679, 16: 128.90556903738158, 17: 126.96768455091889, 18: 127.95060601426769}, 'datelabel': {0: 'Jan 19', 1: 'Feb 19', 2: 'Mar 19', 3: 'Apr 19', 4: 'May 19', 5: 'Jun 19', 6: 'Jul 19', 7: 'Aug 19', 8: 'Sep 19', 9: 'Oct 19', 10: 'Nov 19', 11: 'Dec 19', 12: 'Jan 20', 13: 'Feb 20', 14: 'Mar 20', 15: 'Apr 20', 16: 'May 20', 17: 'Jun 20', 18: 'Jul 20'}}cdf = pd.DataFrame(data)當(dāng)我繪制它時(shí),它在 x 軸上顯示相隔 3 個(gè)月的數(shù)據(jù)我需要顯示 x 軸上的所有點(diǎn)。從1月19日開(kāi)始2月19日...2020年10月。我該如何解決?我就是這樣做的g = sns.lineplot('date', 'rate', data=cdf,marker="o")# g.set_xticks(range(0,19))# <--- set the ticks first# g.set_xticklabels(['2011','2012','2013','2014','2015','2016','2017','2018'])g.set_xticklabels(cdf.datelabel, rotation=90)plt.tight_layout()plt.show()我嘗試先設(shè)置 xticks,然后向其添加值,但它不起作用。
如何在 x 軸上繪制所有值
慕尼黑5688855
2023-10-18 16:10:04

