我認(rèn)為這沒(méi)關(guān)系����,只需使用點(diǎn)而不是線����。對(duì)于長(zhǎng)時(shí)間運(yùn)行我也沒(méi)有解決方案。
import matplotlib.pyplot as plt
import overpy
api = overpy.Overpass()
result=api.query("area['name:en'='Denmark']->.country;rel['name:en'='Denmark']['type'='boundary']['admin_level'='2'];(way(r)['maritime' != 'yes'](40,-10,70,80);way(area.country)['natural'='coastline'](40,-10,70,80););out geom;")
x=[]
y=[]
i=0
for way in result.ways:
print(f"way {i} of {len(result.ways)}")
if 'natural' in way.tags and way.tags['natural']=='coastline' and len(way.get_nodes(True))>0: #just a test
i=i+1
for node in way.get_nodes(True):
print (f'lon: {float(node.lon):3.4f}; lat: {float(node.lat):3.4f}')
x.append(float(node.lon))
y.append(float(node.lat))
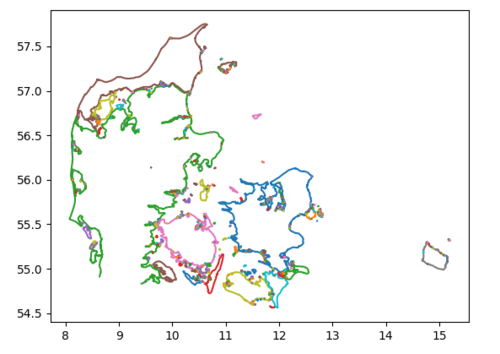
plt.plot(x, y, 'o',label=str(way.id))
plt.show()
由于多邊形而編輯:
import json
import matplotlib.pyplot as plt
import overpy
def getData():
api = overpy.Overpass()
result = api.query("area['name:en'='Denmark']->.country;rel['name:en'='Denmark']['type'='boundary']['admin_level'='2'];(way(r)['maritime' != 'yes'](40,-10,70,80);way(area.country)['natural'='coastline'](40,-10,70,80););out geom;")
x = []
y = []
i = 0
for way in result.ways:
print(f"way {i} of {len(result.ways)}")
# just a test
if 'natural' in way.tags and way.tags['natural'] == 'coastline' and len(way.get_nodes(True)) > 0:
i = i+1
x1 = []
y1 = []
for node in way.get_nodes(True):
print(
f'lon: {float(node.lon):3.4f}; lat: {float(node.lat):3.4f}')
x1.append(float(node.lon))
y1.append(float(node.lat))
x.append(x1)
y.append(y1)
xy = [x, y]
with open('data.txt', 'w') as f:
json.dump(xy, f)
def readDate():
with open('data.txt', 'r') as f:
return json.load(f)
getData()
data = readDate()
last = None
first = None
d = []
k = [[], []]
m = []
while(len(data[0]) > 0):
if last == None and first == None: # Make sure that there are no "ways" at the beginning or end that match the line.
last = [data[0][0][-1], data[1][0][-1]] # Get first and last point of a new line
first = [data[0][0][0], data[1][0][0]]
k[0] = k[0] + data[0][0] # Start the new line
k[1] = k[1] + data[1][0]
data[0].pop(0) # Drop the way
data[1].pop(0)
for j in range(0, len(data[0])): # Check all lines
if first == [data[0][j][-1], data[1][j][-1]]: # If the first ...
print(f'First {first[0]}; {first[1]}')
k = [data[0][j] + k[0], data[1][j] + k[1]]
first = [data[0][j][0], data[1][j][0]]
data[0].pop(j)
data[1].pop(j)
break
if last == [data[0][j][0], data[1][j][0]]: # or the last point continue the current line
print(f'Last {last[0]}; {last[1]}')
k = [k[0] + data[0][j], k[1] + data[1][j]] # Add the segment to the new line
last = [data[0][j][-1], data[1][j][-1]] # Set the point new last point
data[0].pop(j) # Drop the way
data[1].pop(j)
break
if j == len(data[0])-1: # When the for-loop reaches the end, there is no "way" that continue the line
m.append(k)
k = [[], []]
first = None
last = None
if len(data[0]) == 1: # If the last remaining line is a small island, just add it.
k = [data[0][0], data[1][0]]
m.append(k)
data[0].pop(0)
data[1].pop(0)
for i in range(0, len(m)):
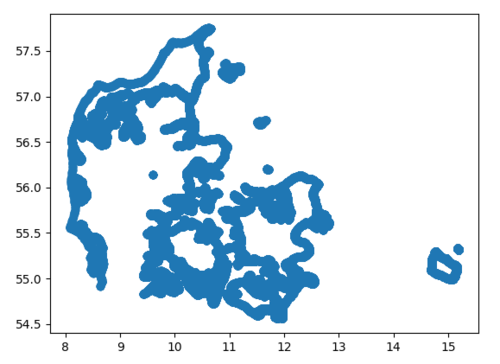
plt.plot(m[i][0], m[i][1], label=f'Denmark')
plt.show()
該算法以盡可能創(chuàng)建多邊形的方式排列 API 中的“方式”���。