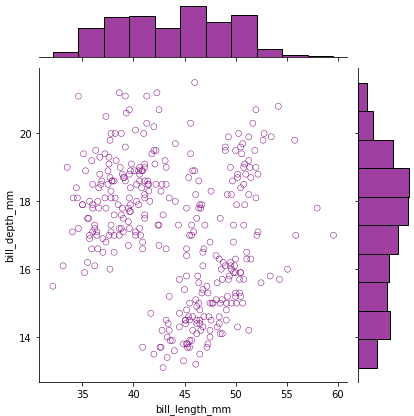
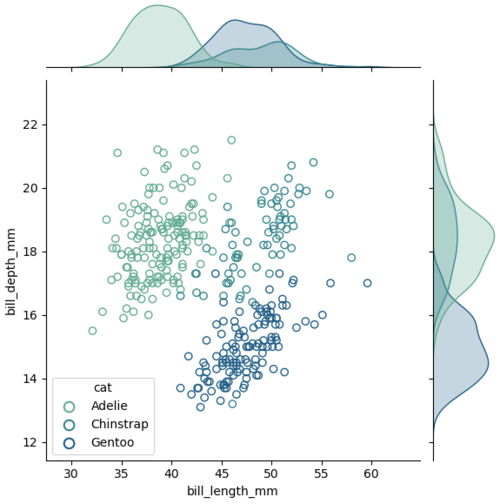
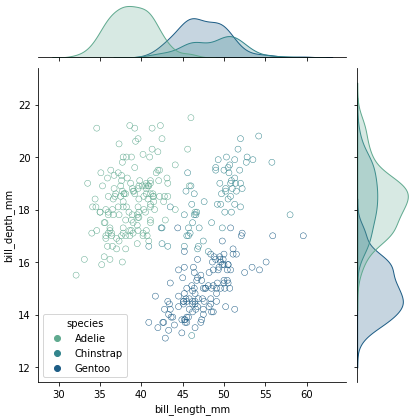
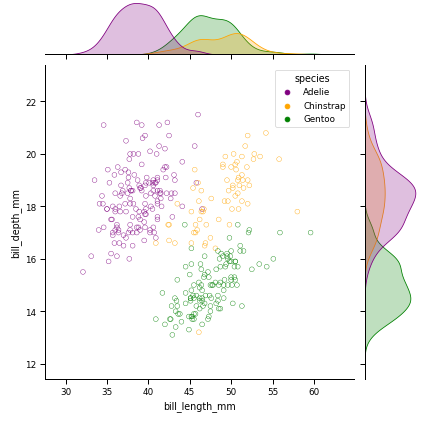
2 回答

TA貢獻(xiàn)1829條經(jīng)驗(yàn) 獲得超4個(gè)贊
由于
seaborn
是 的高級 API?matplotlib
,因此這似乎反映了 中的功能matplotlib
根據(jù)JointGrid 文檔中的示例,參數(shù)為
fc
。要使用fc
,ec
也應(yīng)該使用。指定
fc='none'
,而不指定ec
,將導(dǎo)致空白標(biāo)記。fc
:?facecolor
,?ec
:?edgecolor
'None'
兩者'none'
都有效,但不是None
。測試于
python 3.11.3
,?matplotlib 3.7.1
,seaborn 0.12.2
import seaborn as sns
# load data
df = sns.load_dataset("penguins", cache=False)
# plot
g = sns.jointplot(data=df, x="bill_length_mm", y="bill_depth_mm",
? ? ? ? ? ? ? ? ? ec="purple", fc="none", color='purple')
當(dāng)
hue
用于 時(shí)seaborn v0.12
,fc=
似乎不起作用。
import seaborn as sns
import matplotlib as mpl
# load data
df = sns.load_dataset("penguins")
# create a palette dict with a known color_palette
species = df.species.unique()
palette = dict(zip(species, sns.color_palette(palette='crest', n_colors=len(species))))
# ec requires a single value or a list of values
ec = df.species.map(palette)
# plot
g = sns.jointplot(data=df, x="bill_length_mm", y="bill_depth_mm", ec=ec, hue='species', palette=palette, linewidth=1)
# get the join axes; not the margins
ax_joint = g.ax_joint
# iterate throught axes children
for c in ax_joint.get_children():
? ? # set the facecolor to none
? ? if type(c) == mpl.collections.PathCollection:? ??
? ? ? ? c.set_facecolor('none')
# also change the legend
kws = {"s": 70, "facecolor": "none", "linewidth": 1.5}
handles, labels = zip(*[
? ? (plt.scatter([], [], ec=color, **kws), key) for key, color in palette.items()
])
ax_joint.legend(handles, labels, title="cat")
使用
marker="$\circ$"
產(chǎn)生這個(gè)情節(jié)。
g?=?sns.jointplot(data=df,?x="bill_length_mm",?y="bill_depth_mm",??hue='species',?palette=palette,?marker="$\circ$",?s=100)
這似乎
seaborn v0.12
不起作用如果使用該參數(shù),則需要不止一種顏色。但是,對于超過幾種顏色的任何顏色,?通過將傳遞到的列中的唯一值壓縮到已知的調(diào)色板,可以更輕松地創(chuàng)建。
ec
hue=
palette
hue
如果使用連續(xù)調(diào)色板,指定
n_colors
將生成palette
具有更好的顏色區(qū)分的顏色。'tab10'
是默認(rèn)值palette = dict(zip(df.species.unique(), sns.color_palette('tab10')))
species = df.species.unique()
和palette = dict(zip(species, sns.color_palette('crest', n_colors=len(species))))
#?plot g?=?sns.jointplot(data=df,?x="bill_length_mm",?y="bill_depth_mm", ??????????????????hue='species',?ec=ec,?fc="none",?palette=palette)
調(diào)色板
'Accent', 'Accent_r', 'Blues', 'Blues_r', 'BrBG', 'BrBG_r', 'BuGn', 'BuGn_r', 'BuPu'
'BuPu_r', 'CMRmap', 'CMRmap_r', 'Dark2', 'Dark2_r', 'GnBu', 'GnBu_r', 'Greens', 'Greens_r'
'Greys', 'Greys_r', 'OrRd', 'OrRd_r', 'Oranges', 'Oranges_r', 'PRGn', 'PRGn_r', 'Paired'
'Paired_r', 'Pastel1', 'Pastel1_r', 'Pastel2', 'Pastel2_r', 'PiYG', 'PiYG_r', 'PuBu'
'PuBuGn', 'PuBuGn_r', 'PuBu_r', 'PuOr', 'PuOr_r', 'PuRd', 'PuRd_r', 'Purples', 'Purples_r'
'RdBu', 'RdBu_r', 'RdGy', 'RdGy_r', 'RdPu', 'RdPu_r', 'RdYlBu', 'RdYlBu_r', 'RdYlGn'
'RdYlGn_r', 'Reds', 'Reds_r', 'Set1', 'Set1_r', 'Set2', 'Set2_r', 'Set3', 'Set3_r'
'Spectral', 'Spectral_r', 'Wistia', 'Wistia_r', 'YlGn', 'YlGnBu', 'YlGnBu_r', 'YlGn_r'
'YlOrBr', 'YlOrBr_r', 'YlOrRd', 'YlOrRd_r', 'afmhot', 'afmhot_r', 'autumn', 'autumn_r'
'binary', 'binary_r', 'bone', 'bone_r', 'brg', 'brg_r', 'bwr', 'bwr_r', 'cividis'
'cividis_r', 'cool', 'cool_r', 'coolwarm', 'coolwarm_r', 'copper', 'copper_r', 'crest'
'crest_r', 'cubehelix', 'cubehelix_r', 'flag', 'flag_r', 'flare', 'flare_r', 'gist_earth'
'gist_earth_r', 'gist_gray', 'gist_gray_r', 'gist_heat', 'gist_heat_r', 'gist_ncar'
'gist_ncar_r', 'gist_rainbow', 'gist_rainbow_r', 'gist_stern', 'gist_stern_r', 'gist_yarg'
'gist_yarg_r', 'gnuplot', 'gnuplot2', 'gnuplot2_r', 'gnuplot_r', 'gray', 'gray_r'
'hot', 'hot_r', 'hsv', 'hsv_r', 'icefire', 'icefire_r', 'inferno', 'inferno_r', 'jet'
'jet_r', 'magma', 'magma_r', 'mako', 'mako_r', 'nipy_spectral', 'nipy_spectral_r'
'ocean', 'ocean_r', 'pink', 'pink_r', 'plasma', 'plasma_r', 'prism', 'prism_r', 'rainbow'
'rainbow_r', 'rocket', 'rocket_r', 'seismic', 'seismic_r', 'spring', 'spring_r', 'summer'
'summer_r', 'tab10', 'tab10_r', 'tab20', 'tab20_r', 'tab20b', 'tab20b_r', 'tab20c'
'tab20c_r', 'terrain', 'terrain_r', 'turbo', 'turbo_r', 'twilight', 'twilight_r', 'twilight_shifted'
'twilight_shifted_r', 'viridis', 'viridis_r', 'vlag', 'vlag_r', 'winter', 'winter_r'

TA貢獻(xiàn)1797條經(jīng)驗(yàn) 獲得超4個(gè)贊
如果您希望能夠利用該hue參數(shù),首先,定義您的顏色圖。其次,設(shè)置適當(dāng)?shù)纳{(diào)并在調(diào)色板和邊緣顏色參數(shù)中指定顏色圖。
penguins = sns.load_dataset("penguins")
colormap = {"Adelie": "purple", "Chinstrap": "orange", "Gentoo": "green"}
sns.jointplot(
? ? data=penguins,
? ? x="bill_length_mm",
? ? y="bill_depth_mm",
? ? hue="species",
? ? palette=colormap,
? ? ec=penguins["species"].map(colormap),
? ? fc="none",
)
添加回答
舉報(bào)