問題將 DataFrame 中的數(shù)據(jù)繪制到線圖中不包括 x 軸上的“日期”。north_result = list(data.aggregate(pipeline))dates =['Jun','Jul','Aug','Sep','Oct','Nov','Dec','Jan','Feb','Mar','Apr','May']north_result_df = pd.DataFrame(north_result, index=dates)north_result_df.index.name = 'Months'north_result_df.plot.line()問題將 DataFrame 中的數(shù)據(jù)繪制到線圖中不包括 x 軸上的“日期”。north_result = list(data.aggregate(pipeline))dates =['Jun','Jul','Aug','Sep','Oct','Nov','Dec','Jan','Feb','Mar','Apr','May']north_result_df = pd.DataFrame(north_result, index=dates)north_result_df.index.name = 'Months'north_result_df.plot.line()
1 回答
不負(fù)相思意
TA貢獻(xiàn)1777條經(jīng)驗(yàn) 獲得超10個(gè)贊
你可以使用 pyplot
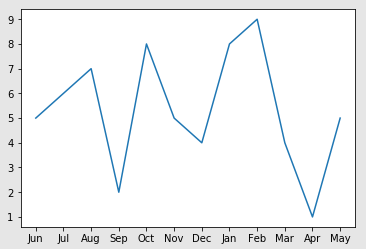
import matplotlib.pyplot as plt
north_result =[5,6,7,2,8,5,4,8,9,4,1,5]
dates =['Jun','Jul','Aug','Sep','Oct','Nov','Dec','Jan','Feb','Mar','Apr','May']
north_result_df = pd.DataFrame(north_result, index=dates)
north_result_df.index.name = 'Months'
plt.plot(north_result_df)
plt.show()
結(jié)果將是這樣的:
添加回答
舉報(bào)
0/150
提交
取消