關(guān)于數(shù)據(jù)
A?B
100?2
200?3
300?4
...
可以看成一個(gè)長這樣[100,100,200,200,200,300,300,300,300,...]
的list
。
標(biāo)準(zhǔn)分布
可以使用numpy
的std()
來計(jì)算標(biāo)準(zhǔn)差,當(dāng)然自己寫公式也可以。比如
In?[1]:?import?numpy?as?np
In?[2]:?np.std([100,100,200,200,200,300,300,300,300])
Out[2]:?78.56742013183862
分布圖
正態(tài)分布圖只是正態(tài)分布的數(shù)據(jù)的分布圖。是否正態(tài)分布取決于你的數(shù)據(jù)??梢钥紤]用seaborn來繪制分布圖。
import?seaborn?as?sns
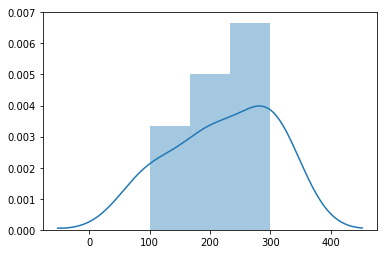
sns.distplot([100,100,200,200,200,300,300,300,300])
分布圖長這樣:

大數(shù)據(jù)量
可以用pandas
讀取。用一個(gè)循環(huán)將數(shù)據(jù)表轉(zhuǎn)為list:
import?pandas?as?pd
df?=?pd.DataFrame({'A':[100,200,300],'B':[2,3,4]})"""
df?像這樣
?????A??B
0??100??2
1??200??3
2??300??4
"""l?=?[]for?i,?j?in?zip(df['A'],df['B']):
????tmp?=?[i]*j
????l.extend(tmp)????
"""
l?像這樣
[100,?100,?200,?200,?200,?300,?300,?300,?300]
"""